Sample Original:
Sample Output:
Display mode: ![]()
Rewordifying level: ![]()
Highlighting mode: ![]()
Display mode: ![]()
Rewordifying level: ![]()
Highlighting mode: ![]()
Get started fast! Follow our Educator Walkthrough, or just log in, click on Educator Central, and get excited about teaching.
When you create student accounts, Rewordify.com keeps careful track of your students' activity. It records the total number of minutes they read, the words they start learning and complete learning, and the errors they make during Learning Sessions. You can see this information for any date range by student, by class, or overall.
Here are the available charts and what they show. These charts are only samples; your charts will have much higher numbers. To see them, log in and click on Educator Central.
How you get it: Click on the Student Accounts tab. The chart displays at the top of the Student List.

This chart shows how many full minutes your students spent reading while logged in to the site, the total number of words they learned, and the total number of errors they made while learning.
Use the Filter box in the Class column to filter by class. When you do, the chart automatically updates. To change the date range, click on the Charts & reports button. Change the dates, but don't generate any reports. Then, click on the Student accounts button again and the chart will automatically update.
How you get it: Click on the Student Accounts tab. Click on a student name.
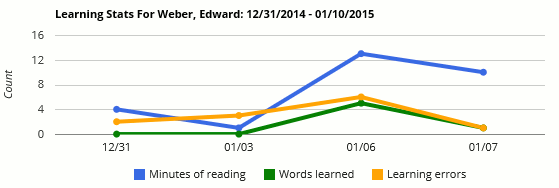
This gives the same information, but for an individual student. It automatically appears for every student as soon as you click his or her name in the Student List.
The rest of the reports are available when you click the Charts & reports button. When you click it, you'll see the Report Options box:
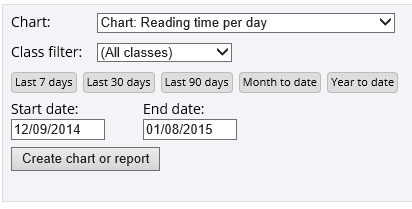
It's very easy to use: just select the chart or report, the optional class filter, the date range, and click Create chart or report.
Here are the charts and reports available on this page:
How you get it: Click on the Charts & reports button.
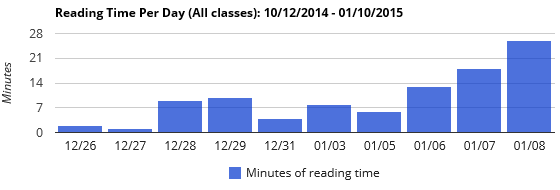
This shows the total number of minutes that the displayed students spent reading while logged in. Note 1: Only whole minutes count. If a student read for 8 minutes and 55 seconds, it counts as 8 minutes. Note 2: The minute counter stops after two minutes if the user does not scroll the page. This prevents people from bringing up a document and walking away from it while it accumulates reading minutes.
How you get it: Click on the Charts & reports button.

This report shows two bars for every day. The blue bars show how many words your students started learning in a Learning Session, but haven't finished. The green bars show how many words your students successfully learned.
If your students start a lot of Learning Sessions, but don't finish learning many words, you'll see a lot of green bars but not many blue bars. (This isn't desirable.)
If your students finish learning most of the words they started learning, you'll see about the same amount of blue and green bars. (This is good!)
How you get it: Click on the Charts & reports button.
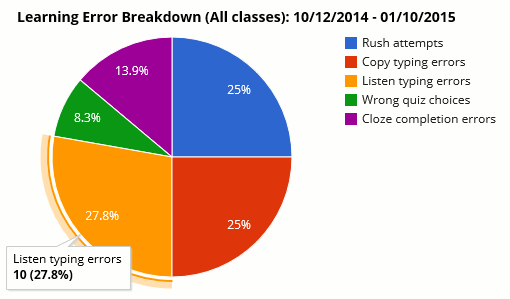
This chart shows the kinds of errors your students made while completing Learning Sessions.
The pie slices are the proportion of each error out of all errors made. Click the chart to see the raw numbers behind the slices.
Rush attempts shows how many times a student tried to rush through reading the passages. To reduce these errors, tell your students to take time to actually read the passages during Learning Sessions.
Copy typing errors shows how many times a student typed a word or phrase incorrectly while looking at it and copying it. To reduce these errors, tell your students to actually look at the word as they type it; don't rely upon memory.
Listen typing errors shows how many times a student typed a word or phrase incorrectly while listening to it. To reduce these errors, suggest to your students to look at the word list on the left as they're typing words; words are always visible in the left-hand word list.
Wrong quiz choices shows how many times a student picked the wrong meaning for a word or phrase from five choices inside a Learning Session. To reduce these errors, ask your students to read each answer choice carefully before selecting one.
Cloze completion errors shows how many times a student did not correctly type the correct word or phrase that completes the blank space in the passage. To reduce these errors, ask your students to refer to the word list on the left to make sure they're typing the word or phrase correctly.
This chart shows a count of the total number of words students learned during each week (blue bars), along with a line showing the total number of learning errors they made during that week (orange line). The counts are summarized by week.
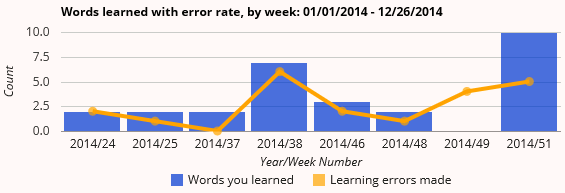
The goal is to reduce the height of the orange line within each blue bar (fewer errors made per word), and increase the size of the blue bars (learn more words).
How to read the chart: In the above chart, students learned 2 words and made 2 errors during week 24 of year 2014. Students learned 2 words and made no errors during week 37. And students made 4 errors but finished learning no words during week 49.
How you get it: Click on the Charts & reports button.
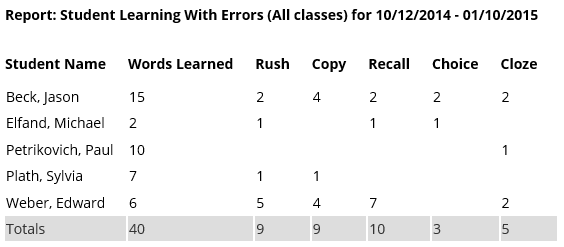
This report shows, by student, the total number of words learned and a breakdown of the errors made while learning those words.
This shows you which students are making which word learning errors (see above for error descriptions), to help you effectively target your interventions.
How you get it: Click on the Charts & reports button.
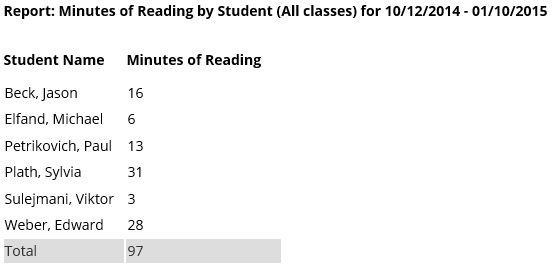
This report shows, by student, the total number of minutes spent reading while logged in.
How you get it: Click on the Charts & reports button.
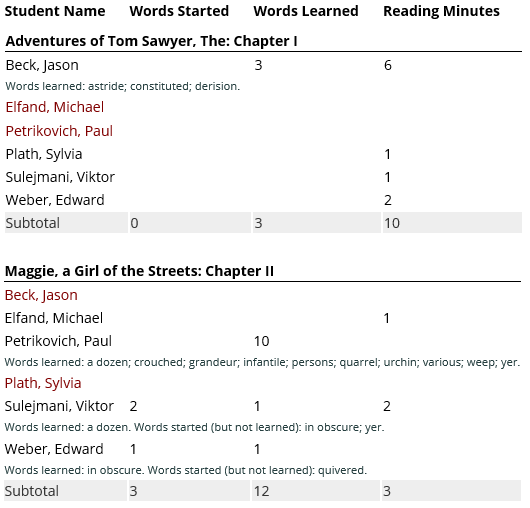
This report shows, for each assignment, and for each student,
Do not expect the numbers on this report to correspond with the numbers on other charts and reports. The numbers on this report apply longitudinally to each document without any regard for time. For example, it shows how many words the students have learned from a particular document without regard to how long it took them to learn it.
The numbers on this report will not match other reports. All other reports are time-based and show progress between a start and and end date. This report is longitudinal: it shows progress on these assignments regardless of when the student read or learned words on the assignments. That's why you can't select start and end dates for this report.
To make the report less cluttered, students who have not read any assignments and have not started learning any words on any assignments are not shown. Students displayed in dark red under an assignment have started reading a different assignment, but haven't started working on that assignment.
How you get it: Click on the Charts & Reports button. Select the report from the dropdown list.
The report shows all student names, login usernames, and passwords. If a password is displayed, that's the password you originally set. If a password shows "[changed by user]", then the user changed his or her password. To protect your student's privacy, that password is not displayed.
You can always change any student's password by logging in and clicking on Educator Central, clicking on the Student Accounts button, and then clicking on the student's name. Click the word Change next to the displayed password.
In order for charts and reports to display correctly:
If there's no data to show in the date range you specified, you'll see a message like this:
Either select a different date range, or wait for students to begin reading and learning on Rewordify.com.
To print any chart, click the words "Print" at the top right of any chart.
Please tell us any suggestions for improving these charts and reports or adding new ones.
You can start exploring right now! Follow our Educator Walkthrough, or just log in, click on Educator Central, and get excited about teaching reading.