Sample Original:
Sample Output:
Display mode: ![]()
Rewordifying level: ![]()
Highlighting mode: ![]()
Display mode: ![]()
Rewordifying level: ![]()
Highlighting mode: ![]()
Become a smarter reader with Progress Charts! They're at the top of the My Learning/My Documents page: the link is at the top of each page after you log in.
Here are the available charts and what they show.
This chart shows how many full minutes you spent reading while logged in to the site. Note: This feature was added on 12/27/2014. No reading time data was collected before that date.

On an actual report (not this picture of one), mouse-hover (or tap) any bar to see details.
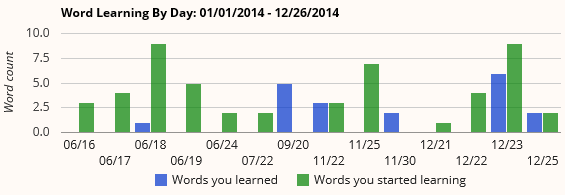
This chart shows two things: how many words that you finished learning each day in a Learning Session (blue bars/left hand bars in each pair), and how many words that you started learning each day by starting a Learning Session (green bars/right-hand bar in each pair):

If you start a lot of Learning Sessions, but don't finish learning many words, you'll see a lot of green bars but not many blue bars. (This isn't desirable.)
If you finish learning most of the words you started learning, you'll see about the same amount of blue and green bars. (This is good!)
In the chart above, the user started learning a lot more words (more green bars) than he finished learning (blue bars).
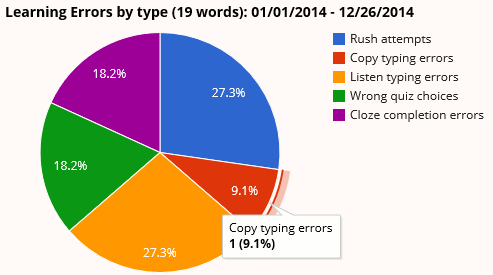
This chart shows the kinds of errors you made while learning words during the date range shown. Note: This feature was added on 12/27/2014. No learning error data was collected before that date.
The pie slices are the proportion of each error out of all errors made. The report title shows the total number of words successfully learned. On an actual report (not this picture of one), mouse-hover or tap each slice to see details.

Rush attempts is a count of how many times you tried to rush through reading the passages. To reduce these errors, take time to actually read the passages during Learning Sessions.
Copy typing errors is a count of how many times you typed a word or phrase incorrectly while looking at it and copying it. To reduce these errors, be sure you're actually looking at the word as you type it; don't rely upon your memory.
Listen typing errors is a count of how many times you typed a word or phrase incorrectly while listening to it. To reduce these errors, try looking at the word list on the left as you're typing it; even though you're listening to the word, it's still visible in the left-hand word list.
Wrong quiz choices is a count of how many times you picked the wrong answer from the quiz inside a Learning Session. To reduce these errors, be sure you read each answer choice carefully before selecting the correct one.
Cloze completion errors is a count of how many times you did not correctly type the correct word or phrase that completes the blank space in the passage. To reduce these errors, refer to the word list on the left to make sure you're typing the word or phrase correctly.
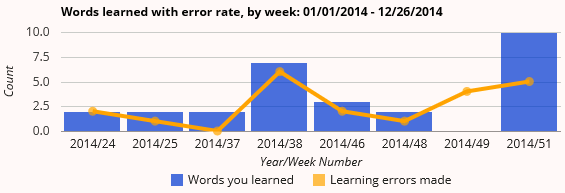
This chart shows a count of the number of words you learned during each week (blue bars), along with a line showing the number of learning errors you made during that week (orange line). The counts are summarized by week. Note: This feature was added on 12/27/2014. No learning error data was collected before that date.

You have two goals: To try to reduce the height of the orange line within each blue bar (fewer errors made per word), and increase the size of the blue bars (learn more words).
How to read the chart: In the above chart, the user learned 2 words and made 2 errors during week 24 of year 2014. The user learned 2 words and made no errors during week 37. And the user made 4 errors but finished learning no words during week 49.
In order to see charts, you must:
The more you read, and the more words you learn in Learning Sessions, the more information the charts will have.
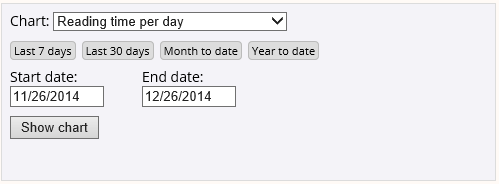
You select the report and the date ranges with the Date Picker:

First, select the report you want from the dropdown list.
Then, enter the date range you want. When you click on a field, a pop-up calendar lets you select the date quickly. To save time, you can click on one of the little gray buttons ("last 7 days", etc.) to auto-fill in common date ranges.
Click "Show chart" to see the chart. Once the chart appears, click "View another chart" to change the chart type or the date range.
If there's no data to show in the date range you specified, you'll see a message like this:
Just follow what it says and you'll be able to see more charts.
To print any chart, click the words "Print chart" at the top right of any chart.